Last June 2013, PHIVOLCS has released a series of risk analysis scenario maps pertaining the West Valley Fault System in case its movement triggers a large earthquake within Metro Manila. These maps provide structural stability analysis of localities that can be affected in case a 6.5M or 7.2M earthquake jolts the metropolis due to the movement of the Valley Fault System that is estimated to be active in every 300 +/- 100 years.
July of last year, we have obtained the Valley Fault System data from PHIVOLCS and traced it along to be presented on an interactive map so the fault line can be visualized on frequently updated basemaps such as on Google Earth's satellite imagery and OpenStreetMap's street-level accurate data. This is with a goal to help our readers visualize the near-precise location of the Valley Fault in Metro Manila and nearby provinces of Bulacan, Rizal, Cavite and Laguna.
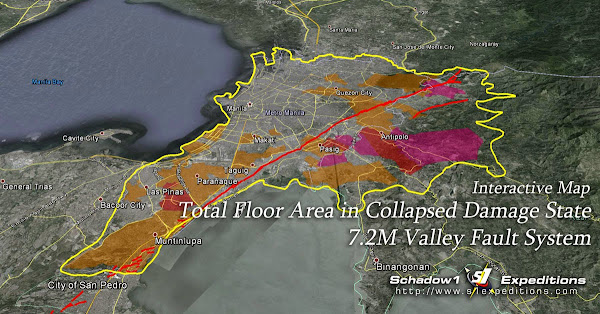
This time, we have pulled in PHIVOLCS' study of floor area of collapsed damaged state in the Greater Metro Manila area in case a 7.2 Magnitude earthquake is triggered by this fault line. As you know, the earthquake's path of destruction does not go along the fault line, instead its energy moves along seismic waves that transfers energy from its source (the epicenter) outwards. Thus, the effect is not isolated from within the trace of the fault line but goes far beyond in a limited swath of area.
We have prepared an interactive map of the Collapsed Damage State in the General Metro Manila area based on PHIVOLCS study and placed as a layer in Google Earth which can be downloaded here.
Yellow line area is the limit of PHIVOLCS' coverage which depicts a low damage probability.
Orange areas are moderate damage probability areas
Purple areas are high damage probability areas
Red areas indicate very high damage probability areas.
It is however noteworthy that there are some areas where even if the fault line traverses, it is still tagged as a low damage probability. This does not automatically depict that the specific area may be exempted from the damage. It only signifies that it is possible that not enough structural stability studies have been made along the path of the fault line or the fault line data has not yet been established during the time the study was made. The risk map was completed by PHIVOLCS in 2013 while the fault line data was from 2014. An example of this would be the fault line data from Pasig River down to Muntinlupa which has not been completely mapped prior to the release of the VFS-GMMA Atlas in 2014.
The following areas are tagged on damage probability under PHIVOLCS' Total Floor Area in the Collapsed Damage State Risk Map for 7.2M Valley Fault System Earthquake.
Very High Damage Probability Areas
- Southern Antipolo
- Rosario, Pasig
- Barangay BF Homes, Parañaque
High Damage Probability Areas
- Cainta, Rizal
- Northern Antipolo
- Montalban, Rizal
Moderate Damage Probability Areas
- Project 6, 8 Quezon City
- Culiat, Pasong Tamo, Bagong Bantay, Katipunan, Libis, Quezon City
- San Bartolome, Novaliches, Quezon City
- Lagro and La Mesa Reservoir, Quezon City
- Marikina City
- San Mateo, Rizal
- Taytay, Rizal
- The rest of Pasig City
- Mandaluyong
- Makati Central Business District
- Bonifacio Global City
- The rest of Taguig
- Manila Bay Reclamation Area (including MOA complex)
- The rest of Parañaque City
- Barangay Talon, Las Piñas City
- Muntinlupa City
Low Damage Probability Areas
- Angono, Rizal
- San Mateo, Rizal
- Rodriguez, Rizal
- The rest of Metro Manila
Note: Areas south of Metro Manila where the Valley Fault Line traverses is not part of the study thus has not been included in the map.
Disclaimer: The interactive map is based on trace from the PHIVOLCS Risk Analysis Map released on June 2013; and the localities mentioned in the list have been produced by browsing through areas specified in the Risk Map when layered over basemaps from Google Earth and OpenStreetMap.
Related Links
- Interactive Map for the West and East Valley Fault Line on Rizal, Metro Manila, Laguna, Cavite
- Barangays and Buildings Traversed by the Valley Fault System
- LIST: 99 Villages and Subdivisions Traversed by the Valley Fault System
- How the Philippines as an archipelago emerged.


We cannot open the map. We live in project 3 quezon city and want to know if our area is high risk. Please make the map easy to download.
ReplyDeleteThis comment has been removed by a blog administrator.
ReplyDelete